By
Umair Khan (UK)
Published Feb
14 2019 01:00 PM 11.3K Views
Skip to footer content
First published on
TECHNET on Mar 24, 2014
https://blogs.technet.microsoft.com/umairkhan/2014/03/24/configmgr-2012-drs-troubleshooting-faqs/
Hi Folks,
Thanks for your feedback
on the previous DRS unleashed post. As promised, this post would take you in
the deep analysis and troubleshooting of the ConfigMgr 2012 Data replication
services issues. I have tried putting up the format as a Q and A format to
answer the questions that came to my mind while I started to go with DRS and as
a part of learning from customer issues. The only prerequisite that I would say
before going through this would be the first part of the series –
http://blogs.technet.com/b/umairkhan/archive/2014/02/18/configmgr-2012-data-replication-service-drs...
Note: The
below questions are there to clarify the concepts of DRS. Do not implement this
in the production until you know it well. For any recommendations or issues,
please open a case with Microsoft Support.
So let’s get
started –
Question 1:
What was the need to
go for DRS? Did the previous file based communications had flaws?
Question 2:
What is DRS from 100
feet? The DRS flow?
Answer 1 and 2:
Both of these
fundamental questions have been covered in great detail in the first part of
the series, the link to which is shared above.
Question 3:
How to go about a DRS
issue?
This is a very
important question that comes to the mind when we are handling a DRS issue. The
initial approach is very important else we can land up in troubleshooting
something which is not even related or the correct path.I say this because DRS
is integrally linked with the site functionality and other SQL components and hence
a very specific approach needs to be followed. With my experience on the
component (Need not be the best approach) I follow-
a. The
History of the issue (Or what changed in the environment) :
This is of utmost
importance to know and can change the way we troubleshoot. Many a times we go
on troubleshooting missing this very fundamental question. From my experience
of handling nearly a ton of DRS issues I found that more than 30% issues are
actually not DRS but something that can be traced to the change made. As an
example – “After restoring the ConfigMgr, the DRS is not working”. Well to
start off it is important to know that how was the ConfigMgr restored. Was that
done in a supported way? Few cases being ‘Snapshot restored’ could be just
rejected here without further troubleshooting. A few which I worked was because
the correct CU (cumulative update) [The CU version before restoration] was not
applied after the site was restored. Other instances could be relating to SQL
where a new update for .NET was applied which actually broke the SQL CLR
managed functionality to process the messages. So in all it is very important
to absorb the finest of the changes that the customer tells or what we can find
from the event logs.
b. Replication
Link Analyzer:
When we are sure
from the first step that everything is fine and done in a correct way or we
don’t know the cause then it is fine to switch to ‘Replication Link Analyzer’.
This is a very useful utility which can detect and also correct the preliminary
issues like SQL service being stopped, SQL broker connectivity, DNS etc. So
better to run this and check if we can find anything which is not normal. Many
a times the Replication link analyzer asks us to reinit the groups or check the
previous failures in which case we know that it was not able to detect any
normal preliminary issues. It generally creates an XML and a
ReplicationLinkAnalizer.log which lets us know the rules it ran and the success
or failure of the rules.
c. Replication
Status on the console:
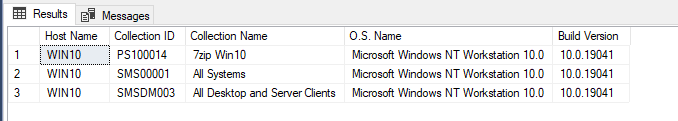
This is located in
the Monitoring -> Database Replication tab. We can click on the link and get
the below information.

It is a very good
summary of the Replication process for the sites. This actually tells us
information on where the issue could be. The global / site data status overall
and also if it is Parent -> Child or Child -> Parent failure issues.
Knowing this helps
us to narrow down the issue as to which site could be the culprit.
The next tabs
‘Parent Site’ and ‘Child Site’ give us information about the configuration of
the replication –

It is important to
go through this once to find out obvious issues. It could be possible that in
DRS issues due to inability to read the stuff from the primary this could
marked as unknown instead of a green tick but that’s fine.
A few of the issues
that have known was the Disk space been full and a very valid reason for the DRS
to break along with the rest features. Also another one being the scenario
where we had two sql instances holding the databases for the CAs and primary
running under broker port 4022 and 4023 but at the time of the recovery of the
primary we gave the port 4022 for the primary which is a clash with the CAS.
Definitely, there are other robust way to find that out which I will deal with
on a later troubleshooting aspect but better if we can nail it down here
itself.
The next two tabs
are ‘Initialization Detail’ and ‘Replication Detail’ which are again a very
important tab introduced from 2012 SP1. The former gives information about the
initialization of the groups and the latter gives information of the
replication after initialization. So if a group is not initialized then there
is no point in looking at the replication status of that group. If we have
information on any group which is listed as failed in the ‘Initialization
Detail’ or not 100 % completed then the site will be in maintenance mode. Now
how to tackle a maintenance mode issue is a separate question. Coming to the
point where we the initialization succeeded but one of the group(s) not showing
as active in the ‘Replication Detail’ tab meaning the initialization was fine
initially but somehow the actual DRS change based replication is not working
for that group(s). Here also comes a very important question –
Will doing a
re-init of this group fix the issue? [How to do a re-init will be discussed in
the coming questions]
The answer is
probably NO. What is seen common to fix any replication group issue is to
re-init the group, but logically re-init will help only if we find anything in
the ‘Initialization tab’ as not completed 100% and also we are not sure if
that’s going to help here if that’s failing because of a database inconsistency
issue. But one thing has to be kept in mind that if we don’t have any issues
with the Initialization then we need not do re-initialization for that group.
Then the point comes how to go about that issue then. The answer is to check
the logs which are described in the coming steps.
d. RCMCtrl.log
This is the
ConfigMgr log for the DRS and located in the bunch of the server logs. The log
is helpful in telling us about the current processing and the status of the site.
Although we do not get more detail as such here even if we know the site is in
maintenance mode or a replication group has failed from this log, we can
increase the verbosity of the log [HKLM\software\Microsoft\SMS\Components\SMS_REPLICATION_CONFIGURATION_MANAGER ->Set
Value ‘Verbose Logging’ to 2].
It is very helpful
in tracking the Bulk copy IN/OUT activity and issues related to it.
e. SpDiagDRS
This is a very
important stored procedure known to everyone but there is very much that is
presented by it.

A Few things to
Note here on important sections and what they signify-
Section 1:
SiteStatus – This tells us
whether the site is replicating or not. Anything other than ACTIVE is not good.
There are various other modes as discussed in the previous post. Of which later
we will discuss Maintenance Mode and Recovery.
CertificateThumbprint [CAS] – The
thumbprint of the certificate used for authentication that contains the site’s
public key (Local DB trusts remote DB). Note: We have a different cert associated
with the Private Key used for the authentication (Remote DB trusts local DB).
More details on this on later sections.
Section 2:
IncomingMessageInQueue – This tells us the
incoming backlog a site has. If the backlog is more due to the number of sites
reporting to it are huge, we may see the links going degraded or failed
sometimes as the heartbeat Synchronizations are not processed in time.
OutgoingMessageInQueue – This tells us the
backlogs yet to clear as we waiting for the communicating sites to get the
messages. This generally fluctuates but if this continues to grow then we know
it is a cause to worry and further troubleshooting as to which site is not
getting the messages.
Section 3:
This is nothing but
the detailed view of the ‘Initialization Status’ on the console. This gives
more information to and fro for each replication group.
Section 4:
This is the
detailed view of ‘Replication Status’ on the console.
Section 5:
Here we get the
information of the other attached sites. This contains the cert name,
thumbprint, Login Name, routes. So if we don’t have the proper routes we cannot
communicate to the other broker. Also, The thumbprint for the primary site here
should actually match to the Thumbprint mentioned in the Section 1 for the
Primary site ( CertificateThumbprint [PRI]). The logic here is
1. The Sending site
signs the service pair security header containing information on the certificates
used for the message with its private key and the receiving site can decrypt
the data only if it has the public key for the sending site.
2. The key exchange
key (that encrypts the 128-bit session key used to encrypt the body of the
message) is encrypted with the public key for the remote user.
and similarly for
the receiving site when it becomes a sending site.
Section 6:
This gives the
general information of the sites in the hierarchy and SiteServerName and
DBServer names along with status and version.
Section 7:
This is a very
detailed information on the heartbeat or LastSentStatus for each group. The
information also contains the conversationIDs etc. This should not be required
until we are dealing with a complex DRS/SSB issue.
f.
VLogs
These are the logs
for the component on the SQL side. They are very handy as to what the component
is doing. A generic query that I use –
select
* from Vlogs where logtext not like '%not sending changes%' AND logtext not
like '%no changes detected%' order by Logtime desc
The exclusions of
these keywords because this is a verbose logs and even if we don’t have any
changed to send we write a text here. Also this query can be modified to our
needs. As in if we want to find error information then we can append and
logtext like '%error%'.
The other very
important aspect is we can see the time so it helps us to trace accurately.
Generally, Issues with RCM are visible here (DRS Changes, BCP etc). We may not
get the broker issues logged in here but then we may identity if there are
communication issues. One such scenario could be –
We did a re-init
for a global group on the primary and on the primary VLogs I see that the site
has asked for Reinit. But then I go to the CAS and check the vlogs after
sometime and don’t see a hint of anything coming on the current timestamp then
we will have to check on the sending site communications (SSB stuffs). Also, we
can increase the verbosity of the VLogs which is already very chatty.
HKEY_LOCAL_MACHINE\SOFTWARE\Microsoft\SMS\Components\SMS_REPLICATION_CONFIGURATION_MONITOR-> DRS
Logging Level to 2. But I believe this should not be
required unless we are troubleshooting Advanced Message tracking.
This basically ends
the generic troubleshooting stuff for a DRS issue. Definitely there is more to
it when working on advanced issues but if we can stick to this core, I think
more than 80% of the issues can be solved.
Question 4:
What is maintenance
mode? When does a site go in the maintenance mode?
A site stays in
maintenance mode until it initializes all of its data. For a CAS site, it will
be in maintenance mode until it initializes all the site data from the all of
its reporting primaries and for a Primary site until it initializes all of its
Global data from the CAS.
The primary stays in
Site maintenance mode at the time of the installation until its
re-initialization completes. Till that time the Console on the Primary would be
read only [Meaning the site cannot be used for production]. For a newly site we
won’t have any site data but consider a scenario of a recovered primary,
When it comes up the CAS asks for the re-initialization of the site data.
The
re-initialization process is basically a BCP out -> Sending -> BCP in
process. It can be arguably questioned that why don’t we use SQL replication
too for reinit but then again this would require a huge chunk of data flowing
on the SQL bandwidth which would be more costlier than a file copy. The
Maintenance mode SiteStatus is 120.
Question 5:
What is bulk copy
program? How to troubleshoot BCPIn and BCPOut Errors?
From technet: http://technet.microsoft.com/en-us/library/ms162802.aspx
The bcp utility
bulk copies data between an instance of Microsoft SQL Server and a data file in
a user-specified format. The bcp utility can be used to import
large numbers of new rows into SQL Server tables or to export data out of
tables into data files. Except when used with the queryout option,
the utility requires no knowledge of Transact-SQL. To import data into a table,
you must either use a format file created for that table or understand the
structure of the table and the types of data that are valid for its columns.
But here in
ConfigMgr we don’t use this this utility but use the APIs mentioned here http://technet.microsoft.com/en-us/library/ms130922.aspx .
CSqlBCP::BCPIN and CSqlBCP::BCPOUT.
We generally face issues with the BCPIn, so the best way is to first of all
reproduce the issue after enabling verbose logging for RCMCtrl.log. This can
help you know which table the BCPIn could be failing. If that gives you enough
info for the record (which many a times it will not), check out the
<TransactionGUID> folder in the RCM.box. The <TransactionGUID>
folder will contain the .bcp and the .rowcount files for all the tables and
there is one more file called bcpError.errors. This will
generally contain the small chunk of the data which failed to get inserted.
But, unfortunately sometimes this file could also be blank (recursive trigger
failing to execute issues.) In such cases it is best to take a SQL profiler for
‘Errors and Warnings’, TSQL, Stored procedures filtering application name for
‘%replication%’ [SMS_REPLICATION_CONFIGURATION_MONITOR thread]. Reproduce the
issue and in the profiler search for the Keyword ‘Exception’ in the EventClass
column or Keyword ‘User Error Message’. Generally we have the constraint
[Primary/Unique Key] getting compromised because of the Triggers associated
with the tables.
A case study –
On the Primary
RCMCtrl.log –
CSqlBCP::BCPIN:
bcp_exec failed. SMS_REPLICATION_CONFIGURATION_MONITOR 3/9/2013
2:23:10 PM 5080 (0x13D8)
***
DRS_Init_BCPIN() failed SMS_REPLICATION_CONFIGURATION_MONITOR 3/9/2013 2:23:10
PM 5080 (0x13D8)
*** BCP fails due
to internal sql error. Check if this table has a trigger failed to
execute. SMS_REPLICATION_CONFIGURATION_MONITOR 3/9/2013 2:23:10 PM 5080 (0x13D8)
CBulkInsert::DRS_Init_BCPIN
: Failed to BCP in SMS_REPLICATION_CONFIGURATION_MONITOR 3/9/2013 2:23:10 PM
5080 (0x13D8)
BCP in result
is 2147500037. SMS_REPLICATION_CONFIGURATION_MONITOR 3/9/2013
2:23:10 PM 5080 (0x13D8)
ERROR: Failed to
BCP in for table PkgPrograms_G with error code 2147500037.
SMS_REPLICATION_CONFIGURATION_MONITOR 3/9/2013 2:23:10 PM 5080 (0x13D8)
Seems like we have
an insert/update trigger associated with the PkgPrograms_G table that is not
able to execute successfully.
Checked the trigger
definition and it seems that the insert trigger here tries to merge the data in
the PkgPrograms_L table.
At the time of
failure this was what the insert trigger trying to achieve:
MERGE
INTO PkgPrograms_L AS
L
USING
(
SELECT
ProgramID,
PkgID,
Name,
SourceSite,
ProgramFlags,
DeviceFlags,
UpdateMask,
Action,
SourceLocaleID FROM
INSERTED
) AS G ON L.ProgramID =
G.ProgramID
WHEN
MATCHED
THEN
UPDATE
SET ProgramID = G.ProgramID, SourceSite = G.SourceSite, ProgramFlags =
G.ProgramFlags,
DeviceFlags
= G.DeviceFlags, UpdateMask = G.UpdateMask,
Action
= G.Action, SourceLocaleID = G.SourceLocaleID
WHEN
NOT MATCHED THEN
INSERT
( ProgramID, PkgID, Name, SourceSite, ProgramFlags, DeviceFlags, UpdateMask,
Action, SourceLocaleID)
VALUES
( G.ProgramID, G.PkgID, G.Name, G.SourceSite, G.ProgramFlags, G.DeviceFlags,
G.UpdateMask,
G.Action,
G.SourceLocaleID ) ;
Error: 2627,
Severity: 14, State: 1
Violation of PRIMARY
KEY constraint 'PkgPrograms_L_PK'. Cannot insert duplicate key in object
'dbo.PkgPrograms_L'.
The duplicate key
value is (WRK00009 , Install FMCNA VPN Icon).
So we got to know
the reason why the trigger was not able to execute successfully. We were
hitting a PRIMARY KEY constraint issue, which doesn’t allow us to insert
duplicate key.
The best part was
we got to know the package ID. It was WRK00009.
When checked this
package, we found that the program was missing the command line in Primary site
WRK but had it correct on the CAS site.
This means there
are definitely some inconsistencies with this package and hence we deleted the
package and the program.
Question 6:
How to go about if a
site is in maintenance mode?
a. Only CAS is
maintenance mode.
First of all we
will be clear with the basics covered in the Step 3. If that helps resolving
the problem great, which many a times won’t. So let’s move ahead, what next –
By Logic, the CAS stays in maintenance until it gets the site data from all the
Primaries.
The groups which
are pending to be completed can be very well checked in the console. For some
reason if you don’t have access to console or don’t like it J we can check that
in the DB –
--Returns
Pending groups
select
* from RCM_ReplicationLinkStatus where SnapshotApplied <>1
You can use the
ReplicationID returned from above and check it in the vReplicationDatatable (ID
column) to know the exact name of the group.
Now that you know
the culprit groups, try checking their group status in the
RCM_DrsInitializationTracking.
select
* from RCM_DrsInitializationTracking where
ReplicationGroup
in
(select
replicationgroup from vReplicationData where ID
in
(select
ReplicationID from RCM_ReplicationLinkStatus where SnapshotApplied <>1))
order
by ReplicationGroup,CreatedTime
From the previous
post we know the various status for replication groups. Barring 99 (Which is an
‘Error’ state) we can try reiniting them. If we have any group with 99 status
we might have to drill down the logs (VLogs, RCMCtrl.log) to find the cause and
correct it. One scenario of BCPIn failed mentioned above is Error state. 99 are
generally related to database inconsistencies.
If it is a single
or few groups they we can drop the .PUB file but If there are multiple such
groups then we can use the below command to re-init them all (But make sure to
check the size of them, in case they are big, the Cx should be aware. exec
spDiagGetSpaceUsed )
update
RCM_DrsInitializationTracking set
InitializationStatus
= 7 where ReplicationGroup in
(select
replicationgroup from vReplicationData where ID
in
(select
ReplicationID from RCM_ReplicationLinkStatus
where
SnapshotApplied <>1))and InitializationPercent not in (0,100)
Note: In some cases where
you know there is one such big group (caused by collection of inventories
rigorously in one of my cases) which is causing the SQL time out, you may need
to get the CAS to go ACTIVE so that it processes the information from the other
sites.
In such cases you
can deliberately bring the CAS to active by running the query –
update
RCM_ReplicationLinkStatus set SnapshotApplied = 1 where SnapshotApplied
<>1
And then later
truncate the bigger group so that it can contain and does not hamper the replication.
b. Primary in
maintenance mode.
First of all we
will be clear with the basics covered in the Step 3. If that helps resolving
the problem great, which many a times won’tJ. So let’s move ahead, what next –
By Logic, the Primary stays in maintenance until the global data is completely
reinitialized from the CAS.
Rest of the
troubleshooting can be checked from above. Nothing much changed from (a).
c. Both CAS
and Primary in maintenance mode.
Yes, we may be
stuck in such scenario too where both the CAS and Primary could be in
maintenance. Here the dilemma is we are pretty much stuck in a Deadlock
situation –
- CAS
stuck in maintenance until the site data in initialized.
- PRI
stuck in maintenance until the global data is initialized. And until the
global data is initialized, PRI cannot send the site data.
So, it is important
to take one of the sites out of maintenance. But the question is to which site?
The Answer is Primary. If we can bring the PRI out of maintenance it can send
the site data up bringing CAS out of maintenance.
So follow the 6(a)
approach to bring the Primary out of maintenance. Once PRI is out of
maintenance it will BCPOut the site data to the CAS.
Question 7:
When do we need to
re-init a group? What are the ways to re-init a group? Is there a way to
re-init the whole global or site data?
As stated before
re-initialization is required only when the Initialization detail for a group
shows that group(s) are not 100% completed or successful. The site(s) would be
generally in maintenance mode owing to the pending initialization.
There are different
ways to re-init a replication group.
For reinitializing
a replication group corresponding to the site data –
a.
Drop a <ReplicationGroupName>-<ChildSiteCode>.PUB on
the CAS site RCM.box. Eg. Hardware_Inventory-PR1.PUB [Where PR1 is the primary
site code for which the data needs to be re-initialized]
b.
The SQL way
Get to know the
latest RequestTrackingGuid in the RCM_DRSInitializationTracking table for the
group and then update its InitializationStatus to 7.
Example – The same
as a where we want to reinit the Hardware_Inventory from the
PR1 site on the CAS database.
--The below query
would return the latest RequestTrackingGuid for the ReplicationGroup
select
top 1 RequestTrackingGUID from
RCM_DrsInitializationTracking
where ReplicationGroup ='Hardware_inventory' and
SiteFulfilling
= 'PR1' order by CreatedTime desc
--Update the
InitializationStatus to 7
update
RCM_DrsInitializationTracking set InitializationStatus =7 where
RequestTrackingGUID
in(
select
top 1 RequestTrackingGUID from
RCM_DrsInitializationTracking
where ReplicationGroup ='Hardware_inventory' and
SiteFulfilling
= 'PR1' order by CreatedTime desc)
For reinitializing
a replication group corresponding to the global data –
a.
Drop a <ReplicationGroupName>.PUB on the Primary site RCM.box. Eg.
Configuration Data.PUB
b.
The SQL way
Get to know the
latest RequestTrackingGuid in the RCM_DRSInitializationTracking table for the
group and then update its InitializationStatus to 7.
Example – The same
as where we want to reinit the Configuration Data for the PR1
site on the PR1 database.
--The below
query would return the latest RequestTrackingGuid for the ReplicationGroup
select
top 1 RequestTrackingGUID from
RCM_DrsInitializationTracking
where ReplicationGroup ='Configuration Data' and
SiteFulfilling
= 'CAS' order by CreatedTime desc
--Update the
InitializationStatus to 7
update
RCM_DrsInitializationTracking set
InitializationStatus
=7 where RequestTrackingGUID
in(
select top 1 RequestTrackingGUID from
RCM_DrsInitializationTracking
where ReplicationGroup ='Configuration Data' and
SiteFulfilling
= 'CAS' order by CreatedTime desc)
Sometimes it could
be possible where you might want to re-initialize the whole global data or the
site data for the site. That is possible from the SQL way but mentioned before
it is better to know the size of the groups associated so that we can get to
know the tentative time that could be required to finish the same.
--For
Re-Initializing the Global Data run this on the Primary site to be
re-initialized
update
rcm_drsinitializationtracking set
InitializationStatus
= 7 where replicationgroup in
(select
replicationgroup from vReplicationData where
replicationpattern
='global') and SiteRequesting = 'PR1'
-- For Re-Initializing the Site Data run this on the CAS site which needs
the Primary site ‘PR1’ to be re-initialized
update
rcm_drsinitializationtracking set
InitializationStatus
= 7 where replicationgroup in
(select
replicationgroup from vReplicationData where
replicationpattern
='site') and SiteRequesting = 'CAS' and SiteFulfilling ='PR1'
Question 8:
How to go about
Recovery_In_Progress and Recovery_Failed issues?
We may have seen
the cases where the Recovery might be stuck in the Recovery_In_Progress state
after the recovery forever. Well in such cases it is important to check the
RCM_RecoveryTracking table.
select
* from RCM_RecoveryTracking
Here for each and
every record or replication group we have a RecoveryStatus. It is important to
understand the different recovery statuses.

So if we have 50 or
55 for any groups we may need to check the VLogs or RCMCtrl.log for more
information. But many a times we do see a group sitting at 5 for a long time
doing nothing. So, there could be a case of recovery as an example of groups
Hardware_Inventory_26 which was existing before recovery and hence the CAS has
information but the recovered DB was of time when this group never existed. So
in such cases we can get rid of this record either by deleting it or making it
deliberately a 9.
In case of recovery
failed issues if we are not able to get much then we can try making it a
deliberate 9 (fooling it to be completed) and then later re-init if required to
find the real causes from the logs.
After the recovery
completes, there is RecoveryPostAction that runs and completes
the tasks like creating SSB certs for child sites, exchanging the SQL machine
certificates, generating public key for child sites etc.
Question 9:
SpdiagDRS shows site is
Active but in console it is still failed. Why so?
Well you might have
have come across this situation where the both the communicating sites shows
ACTIVE in the SpDiagDRS output but shows as Link Failed in the console. So,
what’s wrong here?
First of All, The
site goes ACTIVE once it has finished the Initialization, so practically it is
in Production meaning it is/ or it should be processing the messages. The above
situation can come if you find the InitializationStatus on the console to be
green but still the ReplicationStatus is not yet green.
A valid point to
check now is the IncomingMessage queue backlog. Yes, if the incoming message
queue backlog is high we are yet to get the changes for the groups which
actually Mark the ReplicationStatus for the group as active.
Also, a scenario
where this issue can arise is if the Stored procedure/Function
spGet<article>Changes[Which gets the changes from the corresponding table
for the RG in the Site data]/fnGet<artcile>Changes[Which gets the changes
from the corresponding table for the RG in the Global data] is somehow missing
or deleted by other activities. So, the re-initialization went fine but at the
time of sending the changes or heartbeat this fails. So how to track this
issue, the answer is VLogs. It would clearly show that it is not able to send
the Changes for the corresponding RG because of so and so reason. With that
arises the next question :)
Question 10:
What does 'Link
degraded' or ‘Link Failed’ mean? Does it mean there is an issue?
Database
replication thresholds define when the status of a database replication link is
reported as either degraded or failed. By default, a link is set to degraded
when any one replication group fails to complete replication for a period of 12
consecutive attempts, and set to failed when any replication group fails to
replicate in 24 consecutive attempts.
Beginning with
Configuration Manager SP1, you can specify custom values to fine-tune when
Configuration Manager reports a replication link as degraded or failed. Prior
to Configuration Manager SP1, you cannot adjust these thresholds. Adjusting
when Configuration Manager reports each status for your database replication
links can help you accurately monitor the health of database replication across
your database replication links.
Because it is
possible for one or a few replication groups fail to replicate while other
replication groups continue to replicate successfully, plan to review the
replication status of a replication link when it first reports a status of
degraded. If there are recurring delays for specific replication groups and
their delay does not present a problem, or where the network link between sites
has low available bandwidth, consider modifying the retry values for the
degraded or failed status of the link. When you increase the number of retries
before the link is set to degrade or failed, you can eliminate false warnings
for known issues, allowing you to more accurately track the status of the link.
Link properties
->Alerts tab

Every Replication group has a synchronization interval where it checks or sends
the changes or heartbeats. You can check the same in the console or SpDiagDRS
output–

And there is one
more setting here in the console for the Link Properties –

By default,
summarization occurs every 15 minutes. You can modify the frequency of
summarization for network traffic by editing the Summarization
interval in the properties of the database replication link. The
frequency of summarization affects the information you view in reports about
database replication. You can modify this interval from 5 minutes to 60
minutes. When you increase the frequency of summarization, you increase the
processing load on the SQL Server at each site on the replication link.
So is that an
issue? Well the answer is it depends on what we find. If the SpDiagDRS shows we
are in the maintenance mode then definitely YES we have to fix it. But if it
shows as Active and we see that there always Incoming message backlogs [due to
many sites reporting to it] which gets processed in sometime then maybe not. It
is also better to look at the Logs to verify if there are other issue as
mentioned in the previous question. If there are no issues but only delays in
the processing then we can adjust the setting for the Link Degraded or Link
failed to an Optimum value to avoid it from going to degraded or failed.
Question 11:
What are distributed
views? When can it be helpful?
Distributed views
enable requests that are made at a central administration site for selected
site data, to access that site data directly from the database at a child
primary site. This direct access replaces the need to replicate this site data
from the primary site to the central administration site. Because each
replication link is independent from other replication links, you can enable
distributed views on only the replication links you choose. Distributed views are
not supported between a primary site and a secondary site.
Prefer reading the
technet: http://technet.microsoft.com/en-us/library/gg712701.aspx#BKMK_DBRepControls
Section – ‘Planning
to use Distributed Views’ covers the topic in great detail and also talks about
the limitations of Distributed views.
Known issue with
Distributed views http://blogs.technet.com/b/umairkhan/archive/2013/10/19/the-distributed-views-do-not-get-created-in...
Question 12:
What is sys.tranmission_queue ?
What is its significance? How to clear transmission_queue with cleanup?
In SSBS [SQL Server
Broker Service] terminology, the Sender of the message is called Initiator and
the Receiver of the message is called Target. Depending on the placement of
Initiator and Target the SSBS application's architectures can be categorized in
three different scenarios.
A. Initiator and
Target in the same database in the same SQL Server instance. [Not
supported with ConfigMgr]
B. Initiator and
Target in different databases but still at the same SQL Server instance. [Not
supported with ConfigMgr]
C. Initiator in a
database at one SQL Server instance whereas Target in another database at
another SQL Server instance.
The behavior in
scenario A and B above is almost same. In these cases, SSBS optimizes
performance by writing messages directly to the Target Queue. If, while writing
message to the Target Queue, it encounters any problem (for example the Target
service is not available, Target Queue is disabled, etc.) it keeps that message
in the sys.transmission_queue table temporarily so that it can push the message
to Target Queue once it is available. In the image below, you can see there are
two databases, Initiator and Target, on a SQL Server instance. When Initiator
sends (by using SEND T-SQL command) a message, the message is directly written
to Target Queue from where the Target reads (by using RECEIVE T-SQL command)
it. If the Target sends a response back to the Initiator, the message is
directly written to Initiator Queue.

The behavior in the
third scenario, scenario C, becomes a bit complex and interesting too. In this
case, messages travel from one server to another and the network is involved,
hence SSBS ensures successful delivery of the message by storing messages
temporarily in the sys.transmission_queue temporary queue at Initiator and
removing it from there only if it receives receipt acknowledgement from the
Target. This means as long as messages are in transit they will reside in the
sys.transmission_queue queue. This is what has been depicted in the image
below. You can see there is a queue at database level and there is sys.transmission_queue
temporary queue at instance wide.
When an application
issues the SEND command to send a message, that message is stored in
sys.transmission_queue queue at Initiator, then SSBS sends that message over
the network to the Target and at same time, it marks the status of this message
as waiting for acknowledgement from the Target. On the Target, when the message
is received successfully in the Target queue, it sends the acknowledgement back
to Initiator. At this point only, the message is deleted from
sys.transmission_queue queue at the Initiator. If the Target issues a SEND
command to send a response message back to the sender, the response message
goes into the sys.transmission_queue queue at the Target, again SSBS sends that
response message over the network to the Initiator and at same time, it marks
the status of this response message as waiting for acknowledgement from the
Initiator. On the Initiator, when the response message is received successfully
in the Initiator queue, it sends the acknowledgement back to the Target. At
this point only, the message is deleted from the sys.transmission_queue queue
at the Target.

Please note, the
sys.transmission_queue temporary queue is not specific to a database but rather
is only for each instance.
While
troubleshooting the communications we will see the messages coming and going
out of the queue. If the messages keep on increasing then it is better to check
their status in the transmission_status column.
select
transmission_status,* from sys.transmission_queue
The
transmission_status column contains error if there are issues in communication.
Some of the very common are the certificate issues and Endpoint issues. Follow
the blog –
http://blogs.technet.com/b/umairkhan/archive/2013/12/13/configmgr-2012-drs-and-sql-service-broker-c...
Many a times we may
require to clean up the messages in the transmission_queue which are related to
invalid conversations. So first find the Conversation Handles and then for
cleaning we can use the below query –
end
conversation '<Conversation_Handle>' with cleanup
If there are many
conversations or if you want to clear the whole queue –
declare
@conversation uniqueidentifier
while
exists (select 1 from sys.transmission_queue )
begin
set
@conversation = (select top 1 conversation_handle from sys.transmission_queue )
end
conversation @conversation with cleanup
end
Question 13:
What is
SSB_Dialogpool? Any known issues?
The Stored
procedure spGetSSBDialogHandle first attempts to retrieve a
handle from the Service Broker dialog pool (dbo.SSB_DialogPool) that matches
the contract and conversation required for the message. If there is not an
existing handle the procedure verifies that a valid route exists, and then creates
a new handle in the dialog pool and initializes a new dialog.
ConfigMgrDRSMsgBuilder returns a dialog handle to the calling procedure.
So many a times
after the restore of a site, if there are old conversations handles which were
not valid now, we see that the communication is hampered and the messages are
not able to reach to the destination. It’s better to get rid of the old
conversation handles as it will create a new one if there is nothing for that
service/ queue name.
--Deleting the
references in the SSB_Dialogpool for a site.
delete
from SSB_DialogPool where ToService like '%PR1'
Hope it helps!